Note
Go to the end to download the full example code.
Mean of SPD matrices with NaN values
Estimate the mean of SPD matrices corrupted by NaN values [1].
# Authors: Quentin Barthélemy, Sylvain Chevallier and Florian Yger
#
# License: BSD (3-clause)

import numpy as np
from matplotlib import pyplot as plt
import pandas as pd
import seaborn as sns

from pyriemann.datasets import make_matrices
from pyriemann.geometry.mean import mean_riemann, nanmean_riemann
from pyriemann.geometry.distance import distance_riemann
def corrupt(mats, n_corrup_channels_max, rs):
    n_matrices, n_channels, _ = mats.shape
    all_n_corrup_channels, all_corrup_channels = np.zeros(n_matrices), []
    for i_matrix in range(n_matrices):
        n_corrupt_channels = rs.randint(n_corrup_channels_max + 1)
        corrup_channels = rs.choice(
            np.arange(0, n_channels), size=n_corrupt_channels, replace=False)
        for i_channel in corrup_channels:
            mats[i_matrix, i_channel] = np.nan
            mats[i_matrix, :, i_channel] = np.nan
            all_corrup_channels.append(i_channel)
        all_n_corrup_channels[i_matrix] = n_corrupt_channels
    return mats, all_n_corrup_channels, all_corrup_channels
Generate data
rs = np.random.RandomState(42)
n_matrices, n_channels = 100, 10
mats = make_matrices(
n_matrices, n_channels, "spd", rs, evals_low=50, evals_high=130)
# Compute the reference, the Riemannian mean on all SPD matrices
C_ref = mean_riemann(mats)
# Corrupt data randomly
n_corrup_channels_max = n_channels // 2
msg = (
"Maximum number of corrupted channels:"
f"{n_corrup_channels_max} over {n_channels}"
)
print(msg)
mats, all_n_corrup_channels, all_corrup_channels = corrupt(
mats, n_corrup_channels_max, rs)
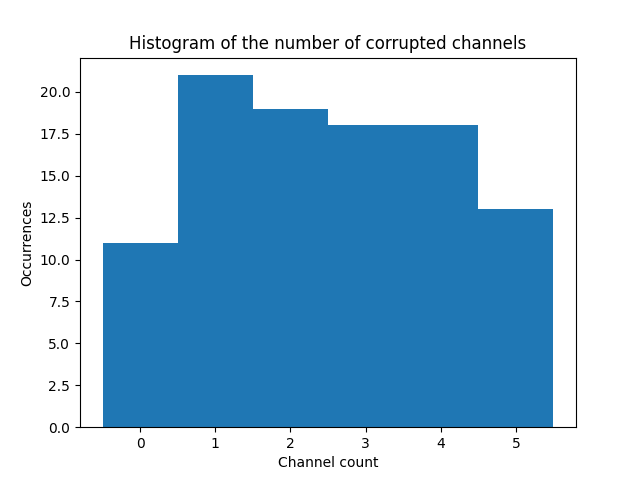
fig, ax = plt.subplots(nrows=1, ncols=1)
ax.set(title="Histogram of the number of corrupted channels",
xlabel="Channel count", ylabel="Occurrences")
plt.hist(all_n_corrup_channels, bins=np.arange(n_corrup_channels_max + 2) - .5)
plt.show()
Maximum number of corrupted channels:5 over 10
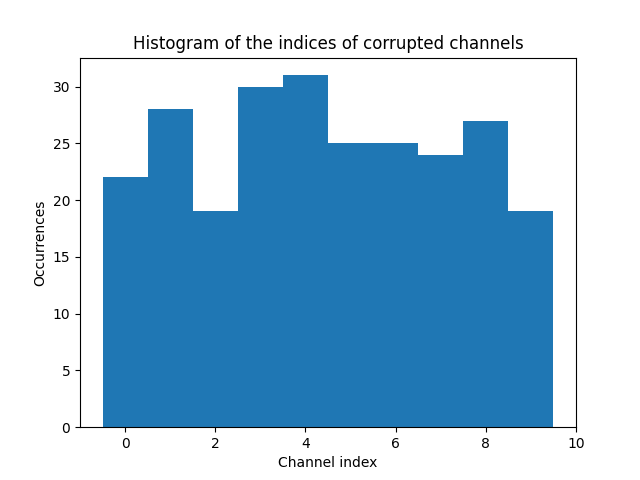
fig, ax = plt.subplots(nrows=1, ncols=1)
ax.set(title="Histogram of the indices of corrupted channels",
       xlabel="Channel index", ylabel="Occurrences")
plt.hist(all_corrup_channels, bins=np.arange(n_channels + 1) - .5)
plt.show()
Estimate means of SPD matrices
Riemannian mean could only be computed on full-rank matrices. A common strategy is called matrix deletion, that is removing all matrices with corrupted channels before computing mean. This results in discarding useful information as uncorrupted channels are removed from the computation of the mean. Nan-mean uses as much information as possible to estimate the mean [1].
# Euclidean NaN-mean
C_naneucl = np.nanmean(mats, axis=0)

# Riemannian NaN-mean
C_nanriem = nanmean_riemann(mats)

# Riemannian mean, after matrix deletion: average only uncorrupted matrices
isnan = np.isnan(np.sum(mats, axis=(1, 2)))
mats_ = np.delete(mats, np.where(isnan), axis=0)
perc = len(mats_) / n_matrices * 100
print(f"Percentage of uncorrupted matrices: {perc:.2f} %")
C_mdriem = mean_riemann(mats_)
/home/docs/checkouts/readthedocs.org/user_builds/pyriemann/checkouts/latest/pyriemann/geometry/base.py:105: UserWarning: Convergence not reached
  return func(X, *args, **kwargs)
Percentage of uncorrupted matrices: 11.00 %
Compare means
Compare distances between the different means and the reference.
d_naneucl = distance_riemann(C_ref, C_naneucl)
print(f"Euclidean NaN-mean, distance to ref = {d_naneucl:.3f}")

d_nanriem = distance_riemann(C_ref, C_nanriem)
print(f"Riemannian NaN-mean, distance to ref = {d_nanriem:.3f}")

d_mdriem = distance_riemann(C_ref, C_mdriem)
print(f"Riemannian mean after deletion, distance to ref = {d_mdriem:.3f}")

# Riemannian NaN-mean gives the best result, and Riemannian mean after matrix
# deletion is worst than Euclidean NaN-mean.
Euclidean NaN-mean, distance to ref = 0.131
Riemannian NaN-mean, distance to ref = 0.073
Riemannian mean after deletion, distance to ref = 0.248
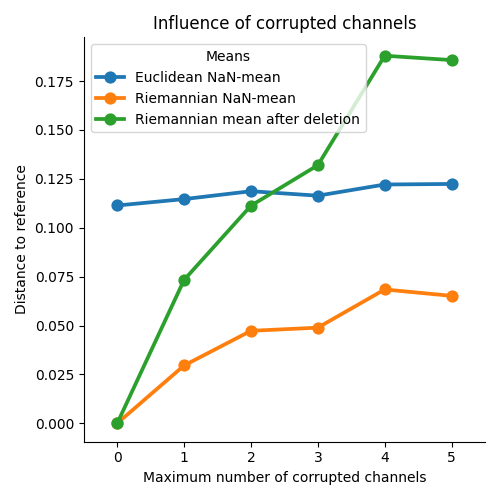
Evaluate influence of corrupted channels
Repeat the previous experiment, varying the maximum number of corrupted channels [1].
mats_orig = make_matrices(
    n_matrices, n_channels, "spd", rs, evals_low=50, evals_high=130)
C_ref = mean_riemann(mats_orig)

df = []
for n_corrup_channels_max in range(0, n_channels // 2 + 1):
    mats = np.copy(mats_orig)
    mats, _, _ = corrupt(mats, n_corrup_channels_max, rs)

    C_naneucl = np.nanmean(mats, axis=0)
    C_nanriem = nanmean_riemann(mats)
    isnan = np.isnan(np.sum(mats, axis=(1, 2)))
    mats_ = np.delete(mats, np.where(isnan), axis=0)
    C_mdriem = mean_riemann(mats_)

    res_naneucl = {"n_corrupt": n_corrup_channels_max,
                   "dist": distance_riemann(C_ref, C_naneucl),
                   "Means": "Euclidean NaN-mean"}
    res_nanriem = {"n_corrupt": n_corrup_channels_max,
                   "dist": distance_riemann(C_ref, C_nanriem),
                   "Means": "Riemannian NaN-mean"}
    res_mdriem = {"n_corrupt": n_corrup_channels_max,
                  "dist": distance_riemann(C_ref, C_mdriem),
                  "Means": "Riemannian mean after deletion"}
    df += [res_naneucl, res_nanriem, res_mdriem]
df = pd.DataFrame(df)

g = sns.catplot(data=df, x="n_corrupt", y="dist", hue="Means", kind="point",
                legend_out=False)
g.set(title="Influence of corrupted channels")
g.set_axis_labels("Maximum number of corrupted channels",
                  "Distance to reference")
plt.tight_layout()
plt.show()
References
Total running time of the script: (0 minutes 6.653 seconds)