Note
Go to the end to download the full example code
One Way manova with Frequenty
One way manova to compare Left vs Right for each frequency.
from time import time

import numpy as np
from pylab import plt
import seaborn as sns

from mne import Epochs, pick_types, events_from_annotations
from mne.io import concatenate_raws
from mne.io.edf import read_raw_edf
from mne.datasets import eegbci

from pyriemann.stats import PermutationDistance
from pyriemann.estimation import CospCovariances

sns.set_style('whitegrid')
Set parameters and read data
# avoid classification of evoked responses by using epochs that start 1s after
# cue onset.
tmin, tmax = 1., 3.
event_id = dict(hands=2, feet=3)
subject = 1
runs = [6, 10, 14]  # motor imagery: hands vs feet

raw_files = [
    read_raw_edf(f, preload=True, verbose=False)
    for f in eegbci.load_data(subject, runs)
]
raw = concatenate_raws(raw_files)

events, _ = events_from_annotations(raw, event_id=dict(T1=2, T2=3))
picks = pick_types(
    raw.info, meg=False, eeg=True, stim=False, eog=False, exclude='bads')

# Read epochs (train will be done only between 1 and 2s)
# Testing will be done with a running classifier
epochs = Epochs(
    raw,
    events,
    event_id,
    tmin,
    tmax,
    proj=True,
    picks=picks,
    baseline=None,
    preload=True,
    verbose=False)
labels = epochs.events[:, -1] - 2

# get epochs
epochs_data = epochs.get_data(copy=False)

# compute cospectral covariance matrices
fmin = 2.0
fmax = 40.0
cosp = CospCovariances(
    window=128, overlap=0.98, fmin=fmin, fmax=fmax, fs=160.0)
covmats = cosp.fit_transform(epochs_data[:, ::4, :])

fr = np.fft.fftfreq(128)[0:64] * 160
fr = fr[(fr >= fmin) & (fr <= fmax)]
Used Annotations descriptions: ['T1', 'T2']
Pairwise distance based permutation test
pv = []
Fv = []
# For each frequency bin, estimate the stats
t_init = time()
for i in range(covmats.shape[3]):
p_test = PermutationDistance(1000, metric='riemann', mode='pairwise')
p, F = p_test.test(covmats[:, :, :, i], labels, verbose=False)
pv.append(p)
Fv.append(F[0])
duration = time() - t_init
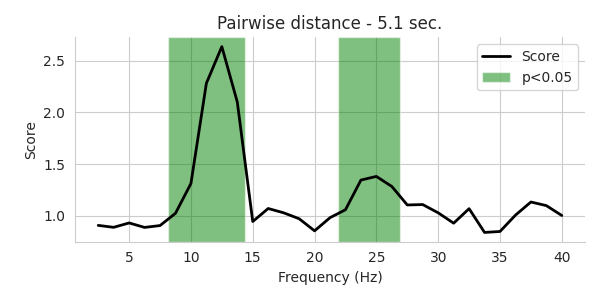
# plot result
fig, axes = plt.subplots(1, 1, figsize=[6, 3], sharey=True)
sig = 0.05
axes.plot(fr, Fv, lw=2, c='k')
plt.xlabel('Frequency (Hz)')
plt.ylabel('Score')
a = np.where(np.diff(np.array(pv) < sig))[0]
a = a.reshape(int(len(a) / 2), 2)
st = (fr[1] - fr[0]) / 2.0
for p in a:
axes.axvspan(fr[p[0]] - st, fr[p[1]] + st, facecolor='g', alpha=0.5)
axes.legend(['Score', 'p<%.2f' % sig])
axes.set_title('Pairwise distance - %.1f sec.' % duration)
sns.despine()
plt.tight_layout()
plt.show()
Total running time of the script: (0 minutes 5.947 seconds)