Note
Go to the end to download the full example code.
Online Artifact Detection with Riemannian Potato Field
Example of Riemannian Potato Field (RPF) [1] applied on EEG time-series to detect artifacts in online processing. It is compared to the Riemannian Potato (RP) [2].
# Authors: Quentin Barthélemy
#
# License: BSD (3-clause)
from matplotlib import pyplot as plt
from matplotlib.animation import FuncAnimation
from mne import make_fixed_length_epochs
from mne.channels import make_standard_montage
from mne.datasets import eegbci
from mne.io import read_raw_edf
import numpy as np
from pyriemann.artifact_detection import Potato, PotatoField
from pyriemann.estimation import Covariances
from pyriemann.geometry.covariance import normalize
def filter_bandpass(signal, low_freq, high_freq, channels=None, method="iir"):
"""Filter signal on specific channels and in a specific frequency band"""
sig = signal.copy()
if channels is not None:
sig.pick_channels(channels)
sig.filter(l_freq=low_freq, h_freq=high_freq, method=method, verbose=False)
return sig
def distance_diageuclid(A, B, squared=False):
diag_A = np.diagonal(A, axis1=-2, axis2=-1)
diag_B = np.diagonal(B, axis1=-2, axis2=-1)
d = np.linalg.norm(diag_A - diag_B, axis=-1)
return d ** 2 if squared else d
def plot_detection(ax, rp_label, rpf_label):
labels = []
ylims = ax.get_ylim()
height = ylims[1] - ylims[0]
if not rp_label:
r1 = ax.axhspan(
ylims[0] + 0.06 * height, ylims[1] - 0.05 * height,
edgecolor="r", facecolor="none",
xmin=-test_time_start / test_duration - 0.005,
xmax=(duration - test_time_start) / test_duration - 0.005)
labels.append(r1)
ax.text(0.25, 0.95, "RP", color="r", size=16, transform=ax.transAxes)
if not rpf_label:
r2 = ax.axhspan(
ylims[0] + 0.05 * height, ylims[1] - 0.06 * height,
edgecolor="m", facecolor="none",
xmin=-test_time_start / test_duration + 0.005,
xmax=(duration - test_time_start) / test_duration + 0.005)
labels.append(r2)
ax.text(0.65, 0.95, "RPF", color="m", size=16, transform=ax.transAxes)
if rp_label and rpf_label:
r3 = ax.axhspan(
ylims[0] + 0.05 * height, ylims[1] - 0.05 * height,
edgecolor="k", facecolor="none",
xmin=-test_time_start / test_duration,
xmax=(duration - test_time_start) / test_duration)
labels.append(r3)
return labels
Load EEG data
# Load motor imagery data
raw = read_raw_edf(
eegbci.load_data(2, [5], update_path=True)[0],
preload=True,
verbose=False,
)
eegbci.standardize(raw)
raw.set_montage(make_standard_montage("standard_1005"))
sfreq = int(raw.info["sfreq"]) # 160 Hz
# Select the 21 channels of the 10-20 montage
raw.pick_channels(
["Fp1", "Fpz", "Fp2", "F7", "F3", "Fz", "F4", "F8", "T7", "C3", "Cz", "C4",
"T8", "P7", "P3", "Pz", "P4", "P8", "O1", "Oz", "O2"], ordered=True)
ch_names = raw.ch_names
ch_count = len(ch_names)
# Define time-series epoching with a sliding window
duration = 2.5 # duration of epochs
interval = 0.2 # interval between epochs
Downloading EEGBCI data
Download complete in 10s (2.4 MB)
NOTE: pick_channels() is a legacy function. New code should use inst.pick(...).
Riemannian potato
Riemannian potato (RP) [2] selects all channels and filter between 1 and 35 Hz.
# RP definition
z_th = 2.0 # z-score threshold
low_freq, high_freq = 1., 35.
rp = Potato(metric="riemann", threshold=z_th)
# EEG processing for RP
rp_sig = filter_bandpass(raw, low_freq, high_freq) # band-pass filter
rp_epochs = make_fixed_length_epochs( # epoch time-series
rp_sig, duration=duration, overlap=duration - interval, verbose=False
).get_data(copy=False)
rp_covs = Covariances(estimator="scm").transform(rp_epochs)
# RP training
train_covs = 45 # nb of matrices for training
train_set = range(train_covs)
rp.fit(rp_covs[train_set])
Using data from preloaded Raw for 603 events and 400 original time points ...
0 bad epochs dropped
Riemannian potato field
Riemannian potato field (RPF) [1] combines several potatoes of low dimensionality, each one designed to capture a different kind of artifact typically affecting some specific spatial area (i.e. subsets of channels) and/or specific frequency bands. RPF is further improved in [3] by using different metrics for each potato, which are suited for detecting different artifact types.
BCI or NFB applications aim at the modulation specific brain oscillations, it is thus advisable to exclude such frequencies from potatoes so as to prevent desirable brain modulations to be detected as artifactual.
# RPF definition
p_th = 0.01 # probability threshold
rpf_config = {
"RPF eye_blinks": { # for eye-blinks
"ch_names": ["Fp1", "Fpz", "Fp2"],
"low_freq": 1.,
"high_freq": 20.,
"metric": "riemann",
},
"RPF occipital": { # for high-frequency myogenic artifacts
"ch_names": ["O1", "Oz", "O2"],
"low_freq": 25.,
"high_freq": 45.,
"metric": {"mean": "riemann", "distance": distance_diageuclid},
"cov_normalization": "trace", # trace-norm to be insensitive to power
},
"RPF global_lf": { # for low-frequency artifacts in all channels
"ch_names": None,
"low_freq": 0.5,
"high_freq": 3,
"metric": "riemann",
}
}
rpf = PotatoField(
metric=[conf["metric"] for conf in rpf_config.values()],
z_threshold=z_th,
p_threshold=p_th,
n_potatoes=len(rpf_config)
)
# EEG processing for RPF
rpf_covs = []
for p in rpf_config.values(): # loop on potatoes
rpf_sig = filter_bandpass(raw, p.get("low_freq"), p.get("high_freq"),
channels=p.get("ch_names"))
rpf_epochs = make_fixed_length_epochs(
rpf_sig, duration=duration, overlap=duration - interval, verbose=False
).get_data(copy=False)
covs_ = Covariances(estimator="scm").transform(rpf_epochs)
if p.get("cov_normalization"):
covs_ = normalize(covs_, p.get("cov_normalization"))
rpf_covs.append(covs_)
# RPF training
rpf.fit([c[train_set] for c in rpf_covs])
NOTE: pick_channels() is a legacy function. New code should use inst.pick(...).
Using data from preloaded Raw for 603 events and 400 original time points ...
0 bad epochs dropped
NOTE: pick_channels() is a legacy function. New code should use inst.pick(...).
Using data from preloaded Raw for 603 events and 400 original time points ...
0 bad epochs dropped
Using data from preloaded Raw for 603 events and 400 original time points ...
0 bad epochs dropped
/home/docs/checkouts/readthedocs.org/user_builds/pyriemann/checkouts/latest/pyriemann/geometry/base.py:105: UserWarning: Convergence not reached
return func(X, *args, **kwargs)
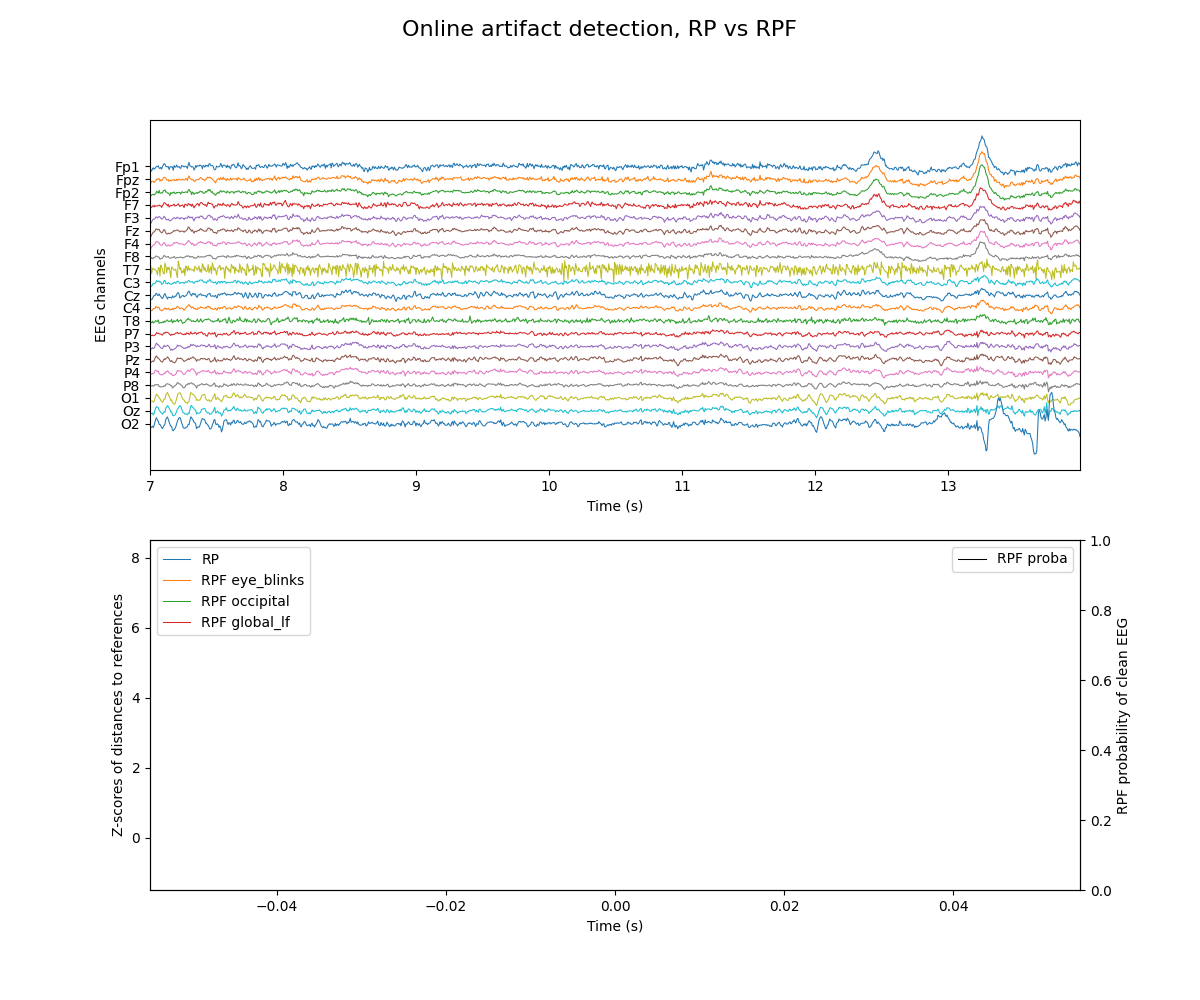
Online Artifact Detection with Potatoes
Detect artifacts/outliers on test set, with an animation to imitate an online acquisition, processing and artifact detection of EEG time-series. Remark that all these potatoes are semi-dynamic: they are updated when EEG is not artifacted [1].
# Prepare data for online detection
test_covs_max = 400 # nb of epochs to visualize in this example
test_covs_visu = 100 # nb of z-scores/proba to display simultaneously
test_time_start = -2 # start time to display signal
test_time_end = 5 # end time to display signal
test_duration = test_time_end - test_time_start
time_start = train_covs * interval + test_time_start
time_end = train_covs * interval + test_time_end
time = np.linspace(time_start, time_end, int((time_end - time_start) * sfreq),
endpoint=False)
raw.filter(l_freq=0.5, h_freq=75., method="iir", verbose=False)
eeg_data = 1e5 * raw.get_data()
sig = eeg_data[:, int(time_start * sfreq):int(time_end * sfreq)]
eeg_offset = - 15 * np.linspace(1, ch_count, ch_count, endpoint=False)
covs_t, covs_z = np.empty([0]), np.empty([len(rpf_config) + 1, 0])
covs_p = np.empty([0])
fig, ax = plt.subplots(figsize=(12, 10), nrows=2, ncols=1)
fig.suptitle("Online artifact detection, RP vs RPF", fontsize=16)
ax[0].set(xlabel="Time (s)", ylabel="EEG channels")
ax[0].set_xlim([time[0], time[-1]])
ax[0].set_yticks(eeg_offset)
ax[0].set_yticklabels(ch_names)
pl = ax[0].plot(time, sig.T + eeg_offset.T, lw=0.75)
labels = []
ax[1].set(xlabel="Time (s)", ylabel="Z-scores of distances to references")
pl2 = ax[1].plot(covs_t, covs_z.T, lw=0.75)
for c, l in enumerate(["RP"] + [*rpf_config]):
pl2[c].set_label(l)
ax[1].set_ylim([-1.5, 8.5])
ax[1].legend(loc="upper left")
axp = ax[1].twinx()
axp.set(ylabel="RPF probability of clean EEG")
pl3 = axp.plot(covs_t, covs_p, lw=0.75, c="k", label="RPF proba")
axp.set_ylim([0, 1])
axp.legend(loc="upper right")
<matplotlib.legend.Legend object at 0x7c8e772c52a0>
# Prepare animation for online detection
def online_detect(t):
global time, sig, labels, covs_t, covs_z, covs_p
# Online artifact detection
rp_label = rp.predict(rp_covs[np.newaxis, t])[0]
rp_zscore = rp.transform(rp_covs[np.newaxis, t])
rpf_label = rpf.predict([c[np.newaxis, t] for c in rpf_covs])[0]
rpf_zscores = rpf.transform([c[np.newaxis, t] for c in rpf_covs])
rpf_proba = rpf.predict_proba([c[np.newaxis, t] for c in rpf_covs])
if rp_label == 1:
rp.partial_fit(rp_covs[np.newaxis, t], alpha=1 / t)
if rpf_label == 1:
rpf.partial_fit([c[np.newaxis, t] for c in rpf_covs], alpha=1 / t)
# Update data
time_start = t * interval + test_time_end
time_end = (t + 1) * interval + test_time_end
time_ = np.linspace(time_start, time_end, int(interval * sfreq),
endpoint=False)
time = np.r_[time[int(interval * sfreq):], time_]
sig = np.hstack((sig[:, int(interval * sfreq):],
eeg_data[:, int(time_start*sfreq):int(time_end*sfreq)]))
covs_t = np.r_[covs_t, time_start]
covs_z = np.hstack((covs_z,
np.vstack((rp_zscore[np.newaxis], rpf_zscores.T))))
covs_p = np.r_[covs_p, rpf_proba]
if len(covs_p) > test_covs_visu:
covs_t, covs_z, covs_p = covs_t[1:], covs_z[:, 1:], covs_p[1:]
# Update plot
for c in range(ch_count):
pl[c].set_data(time, sig[c] + eeg_offset[c])
pl[c].axes.set_xlim(time[0], time[-1])
for lbl in labels:
lbl.remove()
for txt in ax[0].texts:
txt.set_visible(False)
labels = plot_detection(ax[0], rp_label, rpf_label)
for c in range(len(pl2)):
pl2[c].set_data(covs_t, covs_z[c])
pl2[c].axes.set_xlim(covs_t[0] - 0.1, covs_t[-1])
pl3[0].set_data(covs_t, covs_p)
return pl, pl2, pl3
interval_display = 1.0 # can be changed for a slower display
potato = FuncAnimation(fig, online_detect,
frames=range(train_covs, test_covs_max),
interval=interval_display, blit=False, repeat=False)
Plot online detection
# Plot complete visu: a dynamic display is required
plt.show()
# Plot only 10s, for animated documentation
try:
from IPython.display import HTML
except ImportError:
raise ImportError("Install IPython to plot animation in documentation")
plt.rcParams["animation.embed_limit"] = 10
HTML(potato.to_jshtml(fps=5, default_mode="loop"))
Animation size has reached 10532873 bytes, exceeding the limit of 10485760.0. If you're sure you want a larger animation embedded, set the animation.embed_limit rc parameter to a larger value (in MB). This and further frames will be dropped.